Feb 27, 2009

Borrow your way to prosperity

Here's a cheerful graph from the asset managers at Hoisington, showing the total U.S. debt (government, consumer, and industry) as a percentage of GDP:


If you read the entire report, Hoisington makes Jeremy Grantham look bullish by comparison. Crazy bear market theorists are in fashion right now, but before you write these guys off, consider that their fund returned +37% in 2008 and +13% over the last 5 years. They bet big on long-term, zero coupon treasuries and it paid off.

Their big concern is debt deflation: assets are purchased using large amounts of debt during an economic over-expansion, but then fall in value when things slow down and are unable to generate enough income to make the debt service payments. The bank can no longer sell the asset for enough to cover the debt, leading to large writeoffs.

Feb 26, 2009

The true risk of stocks for the long run (part 4)

If you believe these arguments, how does one create an actionable investment strategy? The first step is often overlooked: consider if you should be investing at all. Individuals need to reassess the wisdom of carrying debt while simultaneously investing in stocks. This approach creates implicit leverage in your investment strategy, which will magnify the gains as well as the losses. It is one thing for corporations and hedge funds to employ leverage, but I do not think such a strategy is appropriate for most households. If you have car loans, credit card debt, or even some student loans at a high rate of interest, they should always be paid off before you start investing.

The mortgage payoff question is less clear cut. The expected return from paying off your mortgage may be lower than investing in stocks, but the mortgage is a risk-free investment. Consider: if it were a no-brainer to take a large mortgage and invest the money in the stock market, why would banks even bother writing mortgages? They could be much more profitable by just investing those funds directly in stocks. The interest tax deduction is frequently evangelized, but the true value of it actually depends on your marginal tax rate as well as the size of the standard deduction versus your itemized deductions. Even if you do get a deduction for it, does it make sense to pay $1.00 in interest to save $0.25 in taxes? You’d still be better off it you had never spent the $0.75 in the first place. It is also worth considering that if you have $100,000 and you give it to your financial adviser to invest, he will earn an annual fee on those funds. If you use it to pay down your mortgage, your financial adviser receives no commission. So what course of action are most advisers going to recommend?

On the other hand, it probably makes sense to prioritize tax-advantaged accounts like the Roth IRA ahead of the mortgage paydown, since there is a limited window for contributions to a Roth IRA (each tax year forces you to “use it or lose it” as there are no retroactive contributions). Similarly, 401k contributions necessary to receive your employer’s matching funds should also take priority over mortgage elimination. But blithely putting as much as you possibly can in a 401k or IRA just because it has some tax advantages is sub-optimal for most investors.

Once the decision to invest has been made, the percentage in stocks and bonds must be determined. Unfortunately, I don’t have a grand unified theory of asset allocation. The best starting point is using traditional mean-variance optimization from modern portfolio theory to create the efficient portfolio. The output would look something like this (the actual output would differ from this graph because I would include asset returns and correlations prior to 1970 up through the present day):


My point here is not that the traditional approach to portfolio construction is flawed; the output (the graph) is reasonable, but the interpretation of the results leads investors astray. This graph tends to make people think that a higher percentage investment in stocks guarantees them a higher return over the long run. A fancy graph makes anything more believable due to the “quantification of fantasy” principle. So investors pick a risky asset allocation that is on the right side of the curve, because that is where you get the highest expected return for each unit of risk (approximately 80% stocks, 20% bonds). However, I believe that for the vast majority of individual investors – those who are financially unsophisticated and saving towards retirement or other long-term goals – the optimal portfolio favors minimizing variance rather than maximizing return/risk. That occurs at the left-most point on the graph - 25% stocks, 75% bonds.

Therefore, the appropriate mix of stocks versus bonds would almost certainly lower than the "bond allocation equals your age" rule of thumb that many use (i.e. if you are 25 years old, you should hold 25% of your assets in bonds). For someone nearing retirement, it is probably lower than the 53% allocated to stocks by Vanguard's Target Retirement 2010 fund. For a young person in their 20's or 30's, it is probably much less than the 90% allocated to stocks by Vanguard's Target Retirement 2050 fund. A very rough estimate of my generally recommended portfolio would invest one-third of its value in each of the following asset classes:
  • Equities, distributed between US, developed, and emerging markets
  • Inflation protected securities, such as TIPS
  • Other bonds like treasuries, corporate, and high-yield

This would be a time-independent allocation that would remain fixed throughout someone's accumulation phase, with a possible reduction in the equity exposure to 20% once the investor enters retirement. Annual rebalancing is assumed and the individual asset classes would be held in index mutual funds with low-cost, passive management.

Some will object to such a low allocation to equities (33%). They will say that over the long term, inflation will destroy the purchasing power of your portfolio. Personally, I think inflation has been used to scare many investors into holding more stocks than they should. If you look at equity returns from the 1970s when the US had high inflation, stocks held up better than bonds but I would hardly call them a good investment over the period. Nonetheless, inflation risk is a legitimate concern, and that is addressed by the 33% allocation to Treasury Inflation Protected Securities (TIPS). These are bonds issued by the US government that increase in value with inflation. Most investors are unfamiliar with them because the government doesn’t run TV commercials telling you to buy them and financial advisers have little incentive to push them due to their lower expected returns. However, they can help protect you from unexpected inflation and are as safe as any government bond (they have no credit risk). You can buy them directly from the Treasury for free, or you can purchase a mutual fund or ETF that manages them for you for a small fee. Because they are bonds, TIPS are best held in a tax-advantaged account like a 401k or IRA.

When times are good and stocks are posting double digit returns, no one feels the need to question how returns are being generated (see: Madoff, Stanford, et al). Investors’ skepticism goes out the window because they think there is easy money to be made. We are all prone to recency bias, believing that the future will look like the not-too-distant past. It is only when risk comes to the forefront that investors reevaluate their exposure to unfavorable outcomes. They realize that risk is not just a number on a page like standard deviation, it is a significant loss of wealth that can affect your quality of life. This also means that investors need to be extremely skeptical of anyone proposing a radical change in investment philosophy – acting out of fear is no better than acting out of greed. If the market drops 50% and you sell all your stocks, what will you do when it starts to recover? I believe it is far better to adopt a reasonable, consistent plan of saving and investing that allows some upside but more importantly, protects you from the disastrous downside. The ideas in this paper are not new; many of them are condensed from arguments made by Paul Samuelson and Zvi Bodie, among others. I appreciate their efforts in challenging the conventional wisdom.

Feb 25, 2009

The true risk of stocks for the long run (part 3)

If investors have been systematically underestimating the risk of holding stocks, where did this bias come from? The financial services industry deserves some of the blame, as do individual investors.

Financial advisers are compensated based on their ability to get clients to invest primarily in equity funds instead of bond funds because higher management fees can be earned on equity funds. It is a lot easier to collect a 2% expense ratio from a stock fund earning 12% than a bond fund earning 5%. There is also a herd mentality - if you put your clients in safe but low return investments, when they hear about their neighbor's awesome returns for 2 or 3 years in a row, you are likely to be out of a job. So advisers try to stay close to the benchmark of what everyone else is doing and speak of performance in relative terms, "we outperformed the S&P 500 by 5% last year." But if the S&P lost 40%, you still lost 35%. As the saying goes, “you can’t eat relative returns,” meaning that if you depend on your portfolio for living expenses, a 35% loss may drastically reduce your standard of living. Another common fallacy: many people think that after a 35% loss, a 35% gain will get them back to break-even. In reality, you need a 54% gain the subsequent year just to break even (and if there was inflation, you still lost ground). We must pay more attention to absolute returns and capital preservation along with growth and inflation protection.

Investors are also guilty of focusing on returns rather than risk. With higher expected returns, they can afford to save less and spend more today. If you assume your investments will earn 12% compounded over the next 30 years (illustrated graphically in almost every investment advisor proposal), you hardly need to save anything at all for retirement. This fallacy was believable not only because we heard it from the "experts" but because we wanted to believe it. It is much easier to increase your 401k’s allocation to equities than to save an additional 10% of your income. I’ve heard from people close to retirement who realize they cannot save enough to afford the lifestyle they expect – so they increase their equity allocation in the hopes of doubling down and winning big. People in that situation should be taking less risk, not more. Stock returns in the 1980s and 1990s made it even easier to believe that stocks would always bounce back. Unfortunately, the power of leverage and cheap credit to inflate those returns is only now fully understood.

The bottom line: asset allocation is the single most important factor in investment returns. But investment returns are only a means to achieve an even more important objective: a comfortable retirement (or college savings, or whatever your goal may be). The most certain way to achieve your long-term financial goals comes not from investing a high percentage of your net worth in stocks, but in saving a higher percentage of your after-tax income and reducing household debt. Stocks are unquestionably an important part of any portfolio. I do not deny the benefits of diversification and its ability to improve the risk-return tradeoff. But stocks are not a low risk investment, no matter how long you hold them. They are also not a silver bullet that will allow you to save 3% of your income and guarantee a comfortable retirement just because you put 90% of your IRA in equities. “Saving” should be risk free, and “investing” should be risky. Somewhere along the way we confused the two terms.

Feb 24, 2009

The true risk of stocks for the long run (part 2)

This simple model posits that investing in stocks for 30 years is actually more risky than investing in them for only 1 year. This runs counter to most of the standard advice about investing. Yet you can clearly see that the risk of investing in stocks increases with time by looking at the price of insuring your portfolio against losses buy buying put options on the S&P 500 index. The graph below shows the how the cost of such insurance as a percentage of your portfolio increases as you increase the length of time you want protection. But are there other reasons why stocks really are a better investment for the long run?


My coin flipping model assumes that returns follow a binomial distribution. For this to be true, equity returns must follow a random walk. Although I believe they do but this is open to debate. There is some evidence that returns are not random from year to year, but are actually mean-reverting. This occurs when a stochastic process tends to return to its long-term average value. To put it another way – if stocks drop a lot over several years, eventually prices will be so low that investors start buying, and returns move back to the average. It’s a plausible theory, but the mean reversion effect is weak. You can’t earn abnormal profits by buying after the market drops one year or sell short after it rises the following year. For example, after the market has a bad (good) year, it may continue to drop (rise) for the next several years. Even if we accept mean reversion, it may take so long for returns to get back to the average that an investor can’t rely on them to prevent his portfolio from declining over a 10 or 20 year period. If those 20 years occur near your retirement, there may not be time to recover before you are forced to start drawing down your principal.

Another line of reasoning says that an investor has two types of assets in his portfolio: financial capital and human capital. Early in your career, you have a lot of human capital and little financial capital. Over time, you convert your human capital into financial capital through savings. Returns to human capital are considered risk-free. Since the intelligent investor should consider the risk of all assets in his portfolio, young people with a lot of riskless human capital can afford to take more risk with their financial capital, and shift this mix over time. My problem with this argument is that your human capital should not be viewed as a risk-free asset. Skills and education are valuable but not invulnerable from risks such as technological change or substitution by cheaper labor somewhere else in the world. Moreover, your returns to human capital are not completely independent from the overall economy. Unemployment and declines in equity prices are highly correlated, so at the time you are most likely to lose your job (or at the very least, not receive a raise or promotion), stocks are also likely to be down. A counter argument to my proposal says that if stocks prices go down, you can work more years to replenish your portfolio. However, there are many other risks to your human capital such as illness, injury, or family circumstances that could force you to leave the labor force early. I believe that economic security in retirement is just too important to assume that none of these risks will affect you.

Feb 23, 2009

The true risk of stocks for the long run (part 1)

Are retail investors taking more risk than they realize? The following discussion is directed towards individual investors who are saving for long term goals such as retirement, primarily using a buy-and-hold approach in accounts like a 401k. The conventional wisdom says that the more time until you need your principal, the more risk you can afford to take, and therefore you should invest more in stocks. What is the logic behind this? Let’s say someone offers you a $100 “investment” based on a coin flip. Heads, you earn 33%, tails, you lose 25%. So after one flip you’ll either have $133 or $75. Since each outcome is equally likely (50/50), on average your $100 investment will return $104, or 4%. That’s not too bad. Let’s imagine that each coin-flip in this example is equal to one year of investing in the stock market. Here’s what a simple payoff tree looks like:


However, you can make this investment multiple times. Every time you flip the coin, there is still a 50/50 chance of heads/tails, and the payoffs remain the same. Since the coin is random, you figure that the more times you flip it, the more likely it is that the total number of heads versus tails will even out. This is equivalent to investing over multiple years. Your financial adviser confirms your intuition and tells you that historically, the variation of stock market returns decreases as you invest over longer period of times. It’s a reasonable-sounding (but flawed) assumption that the more times you flip, the less likely you are to get a bunch of heads or tails in a row. But you believe what your financial adviser tells you, so you expect the risk of this investment to go down if you’re willing to flip it four times instead of just once. Here’s what the payoff tree looks like now:


The average ending portfolio value (probability weighted average) is now $117, which is your 4% expected return compounded 4 times. However, something strange has happened with the ending values. The dispersion between the best and worst cases has increased, from $313 to $31. You also notice that there’s a 70% chance (6% + 25% + 38%) you don’t do any better than break even, and a 31% chance (6% + 25%) that your $100 investment is worth $56 or less after 4 flips. If this money was needed to support you in retirement, would you consider these to be good odds? Is your coin-flip investment (stocks) really better than a less risky alternative investment that might guarantee you an ending value of $106 over four years but with no downside risk? This graph from the Wall Street Journal shows that anyone who started investing after 1996 would’ve been better off in a no-risk money market account than in a broad market index:


Consider the coin flip investment similar to investing in stocks. As you increase the number of investment periods above 4, the trends illustrated in this overly simplified example only continue to increase. The best case gets much better, and the worst case gets much worse. The risk of a substantial shortfall increases as you flip the coin more times. This is contrary to the traditional wisdom that a longer investment horizon reduces the risk of volatile assets. I’ve written about the myth of time diversification before, but this example clearly illustrates how the risk to your portfolio’s final value increases, rather than decreases, over time. At the end of the day, the final value is what matters – standard deviation and expected returns are great, but you can’t eat them.

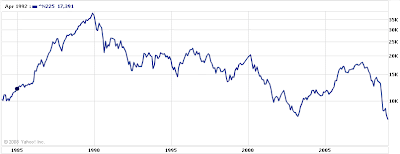
My point is not that investors should avoid stocks entirely, but that they should be aware of the fact that investing for the long term does not eliminate the risk of stocks. Riskier assets have a higher expected return, but not necessarily a higher realized return. You are not guaranteed a higher return just because you took more risk. If investors are going to be compensated for taking risk, then there has to be a real risk of loss over the long term or else why would the risk premium exist? If you still don’t believe me, take a look at a graph of the Nikkei over the last 25 years:


If you think I’m being overly pessimistic, or if you think the Japanese economy is sufficiently different from the US economy, then how about the returns on the S&P 500 from 1966-1982?

Feb 22, 2009

Pension funds and financial economics

Pension funds are experiencing a double-whammy: losses at a time when companies can least afford to fund them. This highlights the advantages of a pension asset allocation devoted entirely to fixed income. This financial economics approach does a better job of matching the duration of a pension's assets with its liabilities. Stockholders would no longer require a risk premium for the company's pension assets, decreasing the firm's cost of capital. Consequently, enterprise value would be higher and hurdle rates for capital budgeting decisions would be lower, encouraging investment and job creation. Finally, better tax efficiency can be achieved by using scarce tax-advantaged accounts to hold income generating bonds rather than equities, which are already tax efficient.

Unfortunately, misaligned incentives in the current pension regime make this change unlikely. Would any rational person claim that a dollar of stocks is worth more than a dollar of bonds? Oddly, this is the fundamental assumption of current pension accounting rules. Corporations can reduce their funding requirements by holding more equities since the expected return is higher. However, this fails to account for the added risk borne by employees (and taxpayers, via the PBGC), who are the beneficiaries of the plan. Under these rules, corporate managers are divided between doing what is best for short-term investors versus what is in the interests of long-term employees.

Feb 21, 2009

Internal rate of return versus time-weighted return

IRR is primarily used by investors in private, non-marketable securities while TWR is more appropriate for mutual funds that invest in liquid, public securities. Since mutual fund managers can't control the timing of cash inflows and outflows, TWR presents a more accurate view of realized returns. IRR considers the timing and magnitude of cash flows, which private equity managers have control over. More details here.

Feb 20, 2009

A bender to remember

When the price of something goes down, consumption tends to increase (all other things being equal). So what do we make of this graph from the Wall Street Journal's article on The Great Interest Rate Wave? The cost of borrowing money decreased over the last 30 years, so everyone loaded up on it. If this trend reverses, it will not be a pretty picture for investors.

Feb 19, 2009

The aftermath of financial crises

That's the title of a recent paper from the National Bureau of Economic Research. The news is not good. The authors excluded emerging markets crises from the first draft of the paper because they thought those results were too dour. Now, it no longer seems like hyperbole to include them. Here's a summary of their findings:
  • On average, house prices decline 35% over 6 years
  • Unemployment rises 7%
  • Equity prices drop 55% over 3 years

By the second measure, we're ahead of schedule (let's hear it for the USA!). Oh, and there's an 86% increase in government debt. Good thing we balanced our budget before this mess came along. Oh wait, we've been running deficits for years? That can't be good.

They base their analysis on the "big five" crises in post-war developed markets: Spain 1977, Norway 1987, Finland, 1991, Sweden, 1991, and Japan, 1992. For good measure they include the 1997 Asian financial crisis, Columbia 1998, and Argentina 2001. Output (GDP) declines 9% from peak to trough but recovers in only 2 years, and none of the crises studied were nearly as bad as the great depression. However, previous problems were national or regional in nature. It is still unclear how the global nature of this disaster will affect the severity and time to recovery.

Feb 17, 2009

The 2008 Periodic Table of Investments

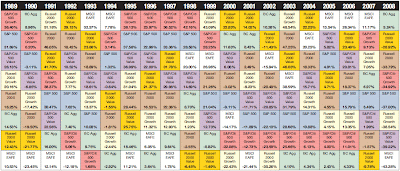
2008 may be a year that most investors would like to forget, but Callan has decided to go ahead and publish their periodic table of investment returns anyway, available here. Unquestionably, this is the worst year in the 20 years of returns shown on the chart. The best asset class, Barclay's aggregate bond index, had a lower return than any other top asset class over the years. This used to be the Lehman bond index, but they shuffled off this mortal coil. 2008's third place winner, the Russell 2000 (-33.79%), performed worse than the worst asset class in every other year.

Feb 16, 2009

Google Trends Revisited

I wrote about Google Trends before but didn't really explore the graphical option (you can also export results to Excel and manipulate the data as you see fit). A few interesting observations. Curiosity about "deflation" started to pick up at the end of last year, versus inflation which spiked earlier in the year as oil hit $147/barrel.


Searches for "cheap wedding" have been steadily increasing over the last five years, especially in 2008. Note the steady decline through the fall and spike at year end. Must be Christmas/New Years engagement surprises?


If the graph below is correct, 2008 may be the year that pawn shops replaced investment banks as sources of capital. I-banks rallied right around the time Lehman collapsed, but then continued trending down. The second image shows a geographic look at the search terms' support: Miami and Las Vegas were both bullish on pawn shops. Coincidence that these cities also have some of the most rapidly falling home values in the country.


Many terms seem to show a cyclical decrease in activity over the summer. Is this due to students being out of school and googling less?

Feb 9, 2009

The Feng Shui Index

Tired of relying on fundamental analysis to figure out where the markets are going? Technical analysis isn't any better. Thankfully, an Asian investment bank, CLSA, has released their Feng Shui Index for 2009. You can download a copy here. Take note that it is based on "not much more than wind, water, a bunch of fanciful farmyard animals and frequent recourse to spirits." Although this is technically the year of the ox, they predict it will be more of a cow.

Feb 8, 2009

Endowment performance in 2008

NACUBO is the National Association of College and Business Officers. They report statistics on endowment size, performance, and asset allocation. Their 2008 endowment studies are available here and overall, they reported an annual return of -3% for 2008. However, the fiscal year for this report runs through June, not December. They also reported a further 23% decline for the first five months of the 2009 fiscal year - from July through November. Things will probably look even worse once December and January's results are included. It is striking to think that professionally managed, highly diversified portfolios, many over a billion dollars, can take such a substantial hit when the market heads down.

They also report on asset allocation by endowment size. Not surprisingly, larger endowments have greater allocations to alternative asset classes such as private equity, hedge funds, and natural resources. It will be interesting to see when the FY09 results are published if this helped or hurt the larger endowments. The average spending rate (the funds that go to support the university's operations) averaged 4.6%. If returns don't improve, I expect this will also decline in 2009, creating a budget shortfall that will leave many universities (and eventually, students) in a tough spot.